


Quality Control Software
Features
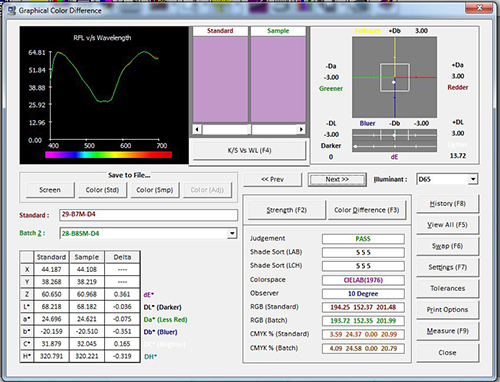
Color Difference Analysis
- Reflectance/Transmission Profiles
- Color on screen
- Color space diagram
- Color Difference values
- Statistical analysis
Color Difference Spaces
- CIE L*a*b*
- Hunterlab
- FMC II
- ANLAB 50
- CMC (1:1)
- CMC (2:1)
- CIE 94
- CIE 2000
- BFD
Illuminants
- A
- D 65
- D 50
- D 75
- C
- F3
- CWF
- Tl 84
- UL 30
- Horizon
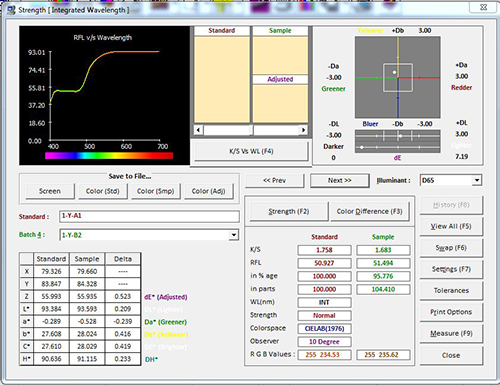
Strength Analysis
- Residual color difference
- Reducing strength of TiO2
- Dyestuff Strengths
- Pigment Strengths Analysis
- Standard, Sample and Adjusted sample profiles
- Color on screen
- Strength difference of Standard and Sample
- Strength analysis by Integrated Wavelength, Maximum Wavelength and User selected Wavelength
- Option to calculate strength using Saunderson correction
Indices
Whiteness, Yellowness and Brightness Indices can be quantified.
Whiteness Index
- Stephensen
- Harrison
- Berger
- ASTM E313
- Stensby
- Hunter
- CIE
- Ganz
Yellowness Index
- ASTM D1925
- ASTM E313
Brightness Index
- TAPPI 452
- ISO 2470
Metamerism Index
Food Color Index
- Tomato Color Index
- Citrus Redness Index
- Citrus Yellow Index
- Equivalent Orange Juice Score
Sugar Whiteness Index
ICUMSA 420 Sugar Score. (International Commission for Uniform Methods in Sugar Analysis)
Paper Indices
- R(X), R(Y), R(Z)
- Scattering Power
- Scattering Co-efficient
- Absorption Power
- Absorption Co-efficient
Gardner Scale
Gray Scales
- AATCC
- ISO 105
Staining Scale
- AATCC
- ISO 105
Opacity Quantification
The hiding power in terms of Opacity can be quantified.
- ISO Opacity
- Tappi Opacity
- R (O) Opacity
Fluorescence Quantification
- O B A Fluroscence component is calculated by measuring sample with UV light & without UV light
- Chromatic Fluroscence component is calculated by measuring sample with visible cutofffilters ( 420nm or 465nm)
For more information please click on Spectrophotometer Flouro
QUALITY CONTROL PACKAGE
1. Creating Your Own Standard Library
- Store your own standards to eliminate the need of comparison
- Comparison with any Physical standard
- Retrieve for any future comparison
- Update, Rename, delete, swap and list options
2. Analysing Incoming Colorant Raw Material
- Colorant strength (color yield) analysis
- Color difference analysis
- Reducing strength analysis of Titanium Dioxide
3. Checking of Substrate / Base
- Measurement of whiteness
- Checking of undesirable yellowness
4. Checking of Outgoing Finished Product
- Color difference analysis against an accepted standard
- Whiteness/ Yellowness measurement in case of white finished product
- Predicting the effect of various illuminants (i.e. Detection of Metamerism)
5. Quality Assurance Purpose
- Study of fastness of dyestuffs / dispersing properties of pigments
- Study of various stages of coloring
- Study of various treatments on the finished product
- Study of effect of Optical Brighteners
- Study of new colorant raw material
- Study of effect of weathering